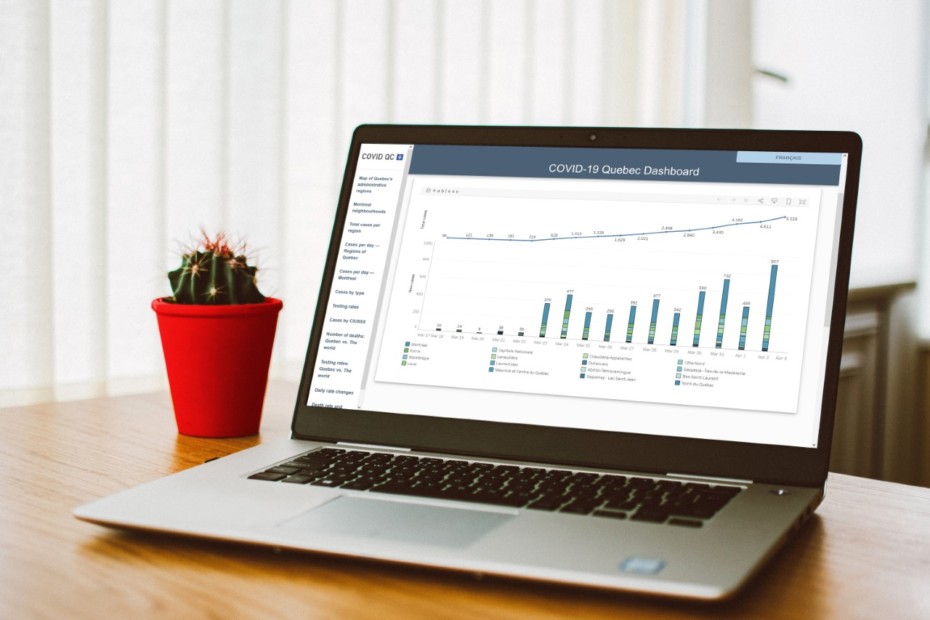
Communities across the world impacted by COVID-19 are navigating a sea of information to help them understand the current pandemic. A team of McGill students and professors have joined forces to offer their expertise on the information frontline through a new analytics dashboard called COVID QC.
Over the Quebec-mandated closure of schools and universities in March, an eager team of McGill analytics and computer science students partnered with Professors Juan Serpa and Mehmet Gumus of the Master of Management in Analytics (MMA) program at the Desautels Faculty of Management to create a dashboard reporting on the situation in Montreal and Quebec.
“We have a team of almost 20 experts in data analytics, software engineering, computer science, and geographic information systems,” says Serpa. “In addition, we have professors supervising the project to ensure that, above all, the data is properly transmitted to the public.”
On the team are Venkatesh Chandra and Ramy Hammam, two final-year MMA students who spearheaded the Canada COVID-19 Monitor last month. Serpa credits the duo, now working on data visualization, with setting the groundwork for COVID QC.
A fight against misinformation
The team leverages data from local, provincial and national government to provide a credible dashboard depicting the situation in Montreal and Quebec.
Aware of how the situation unfolded in places like China, Italy and Iran, the team acted promptly to set up the dashboard, understanding that communicating information is key to the public understanding how the virus behaves.
“If you look at societies like South Korea, Hong Kong, and Singapore, they’re partly winning the battle against COVID-19 with granular and accurate data. This is the biggest weapon we can give to our citizens,” says Serpa.
Most major publications share data on a global or national scale, but very few are able to capture the particular situation at the regional and local levels. People interested in delving deeper into the situation in Montreal and Quebec would previously have needed to navigate a multitude of information at the local, provincial and national level.
Now, COVID QC shares the data in one dashboard while comparing the situation in Montreal and Quebec against the national and global landscape.
A personal stake in the project
Jasmine (Peiran) Jiang (MMA’20), a student working on the project as a data collector, says that it was important for the team to design an intuitive dashboard to help Quebecers better understand the situation.
“We wanted to design this platform for Quebec residents, providing sufficient information by region and borough to give a holistic view of what’s going on,” she says. “Our focus is on offering an accurate, timely, and user-friendly dashboard.”
While everyone on the project team understood the value that an analytics-powered tool would bring to the Quebec community, Jiang had a personal stake in the project.
“I am from Wuhan, which is the centre of this epidemic. I’ve seen how cruel this virus can be – my hometown was on lockdown with my parents in quarantine for more than 70 days and I have lost beloved family members,” says Jiang.
“Personally speaking, this is a hard time,” Jiang continues. “I really want to help because I don’t want anyone else to go through it. I want to raise public awareness that this is a serious situation, and everyone should try their best to protect themselves and the ones they love.”
Jiang hopes that COVID QC will alleviate challenges that arise from a fragmented data ecosystem and arm the Quebec community with the accurate, well-organized information needed to protect themselves.
A vision to share real-time hospital data
The team of analysts and computer scientists are continuing to expand the data sources to provide a more comprehensive snapshot of how the situation is unfolding in Quebec and Montreal. Their vision is to attain hospital data to provide a bed management resource for the province.
“I have seen patients rushed to one hospital but found no medical resources available there,” says Jiang. “In their desperate situation, they needed to try another hospital. Ideally, we want the data to reflect the availability of resources in hospitals.”
Serpa says that the team’s aim is to provide a bed management platform system that will eliminate the need for critically ill individuals to “shop around” for urgent medical help. The platform currently reports on the number of individuals who are hospitalized and in intensive care, but the team hopes to dig deeper.
“One of my research areas is on how society utilizes inventory in times of war. In fact, I have been studying how war-ridden regions utilize their medical resources when they are under a war spell. This is the best context we have to look at today’s pandemic, because hospitals get overloaded.”
In many countries, during war, citizens end up moving from one hospital to another, trying to find available beds. “If we don’t share this information publicly, Quebec could end up in this situation, especially because the outbreaks are clustered in neighbourhoods like in Côte-Des-Neiges—Notre-Dame-De-Grâce currently,” says Serpa.
“If we don’t transmit to people which hospitals are currently overloaded, in real time, our region will have mismatches in the supply and demand of hospital beds. Real-time information-sharing platforms have been successfully implemented in war-torn countries, and has been one of the most effective life-saving measures.”
A cross-faculty collaboration
The development of COVID QC is a result of a collaboration between the Desautels Faculty of Management and the Faculty of Engineering at McGill. In the initial meeting, the group of 20 students formed three teams – data management, Tableau graphs, and website development – and set forth on the project.
In a team of three, Jiang works on data collection and updates. As a first step the team collected historical case information and defined several measures to reflect the seriousness of the situation. Noticing the global trend of cases doubling in a matter of days, this was an important measure to report on. With a focus on accuracy, currency and accessibility, the data is collected daily, verified by the team and manually updated on the dashboard. The team is using graphs and tables to visualize the data and make national and global comparisons.
“This is a meaningful project for all of us,” says Jiang. “Our professor has invested a lot of time and effort into this project and everyone takes their responsibilities seriously. I feel like I’m contributing to the community, and making impact in this difficult time.”
Organizers give a special thanks to all students involved in the project: Janna Agustin (BCom’20), Ruben Alba (MMA’20), Christina Baik (BCom’21), Venkatesh Chandra (MMA’20), Loreina Chew (BA’20), Jonathan Guzzo (MMA’20), Ramy Hammam (MMA’20), Jasmine Jiang (MMA’20), Omar Lafif (MMA’20), Guillaume Lapierre-Berger (BCom’20), Brendan Marks (BEng’22), Bradley McBain (BEng’22), Katianicia Nafissatou (MMA’20), Bogdan Tanasie (BCom’20), Demi Wei (MMA’20), and Jessica Zhang (MMA’20).
Get the most recent data on COVID QC and follow on Facebook and Twitter for frequent updates.