The McGill Bieler School of Environment has announced its first annual round of Spark and Ignite funded research projects. Spark and Ignite are ongoing funding programs designed to help the BSE continue its important work to find interdisciplinary solutions to complex environmental challenges. Among the projects is one that examines climate measurements at the McGill Observatory going back 150 years.
Citizen scientists
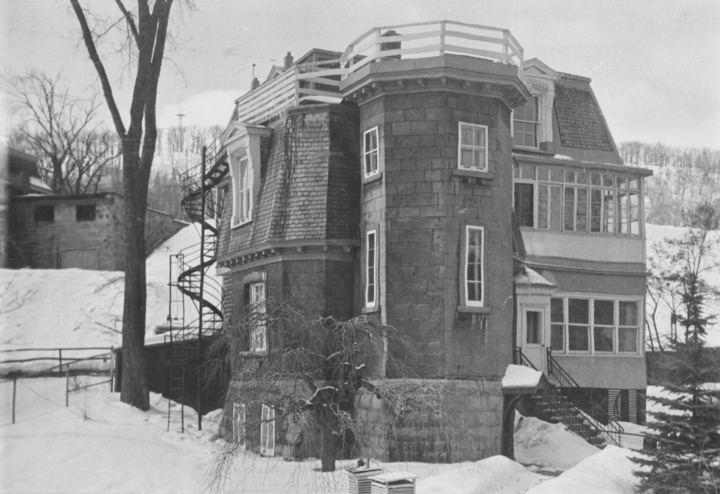
“From 1863 to 1992 McGill ran a weather observatory that collected precious information: weather measurements of all kinds, many times a day. These measurements are in logbooks, and though the logbooks have been scanned on microfilm, and digitized into images, they’re not in a form that is usable,” explains Professor Frédéric Fabry, Bieler School of Environment and Department of Atmospheric & Oceanic Sciences.
The task of transcribing the McGill Weather Observatory logbooks, which represent one of the most complete weather observation data sets in Canada (an estimated 9 million sub-daily measurements) is estimated to take ~50,000 hours – the work lifetime of a person. Logbooks like these exist worldwide and form the most direct measures of climate change we have. For the last five years, the Data Rescue: Archives & Weather (DRAW) initiative has convened a group of students and volunteer “citizen scientists” to carry out these transcriptions.
“There is a field of research called ‘citizen science,’ where non- or lay experts have been contributing to science for a very long time,” explains Associate Professor Renee Sieber, Bieler School of Environment and Department of Geography, and one of DRAW’s scientific leads, along with Fabry and others. “The UK a few years ago celebrated the 150th anniversary of citizen science that they traced back to ‘ramblers,’ who would take evening walks and contribute to the field of phenology (the detection of seasonal changes), for example noting when the crocuses and snowdrops bloomed and daffodils and trees lost their leaves. Activities like the Christmas Bird count from the Audubon Society have been ongoing for over 100 years. Amateurs have been taking very careful observations that have become the backbone of certain sciences, such as ornithology, particularly around the transnational migration of birds.”
Victoria Slonosky, PhD, an independent scholar and historical climatologist who uses past records of weather and climate to analyze and evaluate climate change and variability, is DRAW’s project lead. “After studying historical climatology, I collected a number of historical weather records for Canada in the early 2000s as a post-doc and early career researcher,” says Slonosky. “Prior to DRAW, I started a citizen science project to transcribe these records in 2010. Three centuries of temperature records were published in 2014 for the St. Lawrence Valley. After hearing about the results of the project, researchers at McGill were interested in putting together a similar project for the McGill Observatory records.”
Transcribing more than a century of weather
The McGill DRAW project allows volunteers to participate in the transcription of historical weather logs captured at the McGill weather observatory since 1874, the year when it came under the umbrella of the Meteorological Service of Canada. The weather information contained in these logbooks must be transcribed in a digital format to be used for scientific research. Slonosky oversees a team of transcribers (including four “super-users” who have transcribed 100s of pages and 83 per cent of the transcriptions), and reviews and analyzes the observations, occasionally filling in gaps and correcting or amending details.
The DRAW project also built its own transcription platform to handle the sheer density of observations in the handwritten ledger sheets. One of the transcribers is graduate student Giuliana Garofalo, who is pursuing a Masters of Information Studies (specializing in archival and preservation studies) at McGill and is currently DRAW’s outreach assistant, having joined the team nine months ago.
“I allocate time each week to transcribing logbook pages,” says Garofalo. “I prefer to transcribe pages with qualitative data – some pages have ‘Remarks’ columns – and so I spend more time deciphering handwriting than those who prefer to transcribe quantitative data. The ability to decipher handwriting is sometimes challenging, especially when faced with ink stains or fading, but once you get the hang of it, you’re able to uncover valuable insight into observers’ perceptions of the weather. To date, my favorite finding is from 22 April 1879, where the observer wrote ‘Maple trees budding.’”
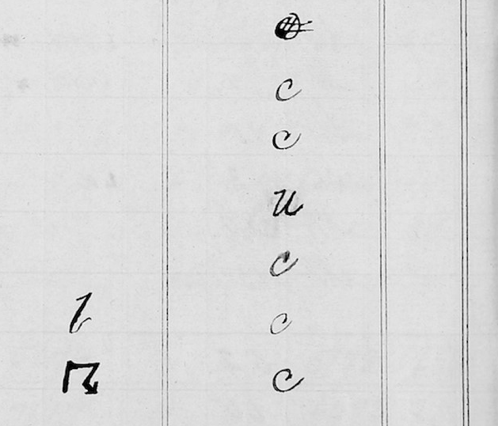
The descriptions of weather phenomena within these logbooks are highly detailed and extend far beyond observations on clear or cloudy skies, or temperature, barometer and precipitation measurements. Scientists at the McGill Observatory used over thirty symbols to describe the weather, ranging from thunderstorms and hail to hoar frost and dust haze. “There are even different symbols to distinguish light, heavy, and torrential rain. My personal favorite symbol is ‘U’, which denotes ‘ugly’ or, potentially threatening weather,” says Garofalo.
Professors Fabry and Sieber’s Ignite project Taking Environmental Citizen Science Contributions to the Next Level represents a new phase of the work, and concerns an assessment of the accuracy of the logbook transcriptions. Drawing on Fabry’s expertise in meteorological data management and and Sieber’s expertise in non-expert use of technologies, the project will use multiple methods, including writing code to automate the process, creating metadata (descriptive data about data) to generate an audit trail for any modifications to the database, sampling the output and assessing the validity of the method. “The challenge we now face is that the transcriptions are of unknown quality, in part because the original transcription used shorthand, or is unreadable, or contains transcription errors,” says Fabry.
The researchers are now at the stage where they have enough information transcribed to work on the data quality and in the process learn how accurate the transcription from the citizen scientists is. When it comes to the value of the data, Sieber is unequivocal about its importance: “This is the only direct empirical evidence of climate change. Everything else is a surrogate or proxy for climate change.”
“Most people who’ve transcribed data only do daily averages,” concludes Fabry. “We are daring to take all the measurements – over 1.5 million unvalidated observations (and growing) transcribed to date – which is why our transcription is a lot slower than many others. The inconvenience is that it takes much longer and that’s why we need all this help to determine its accuracy.”
Sign up here to become a DRAW user